-
ஜெனரல்

The electricity sector in Sri Lanka is largely managed by state-owned corporations, particularly the Ceylon Electricity Board (CEB), with the private sector participation limited to power generation in a relatively small scale. CEB is identified as a strategically important and one of the largest state-owned enterprises (SOE) in Sri Lanka. However, currently it is also amongst the biggest loss making SOEs in the country which is causing huge burden on the public's shoulders. During a period of 10 years from 2010 to 2019, the CEB had accumulated a total loss of over LKR 246 billion1. This is only likely to increase further in 2020 as there was an additional loss of over LKR 62 billion incurred during the year by CEB2.
Hydropower, thermal coal, and thermal oil power plants are the key power generation sources of Sri Lanka accounting for 92% of the power generated on average in the last 5 years. Other non-conventional renewable energy sources such as wind power contributes only a small proportion, 8% on average over the last 5 years3,4.
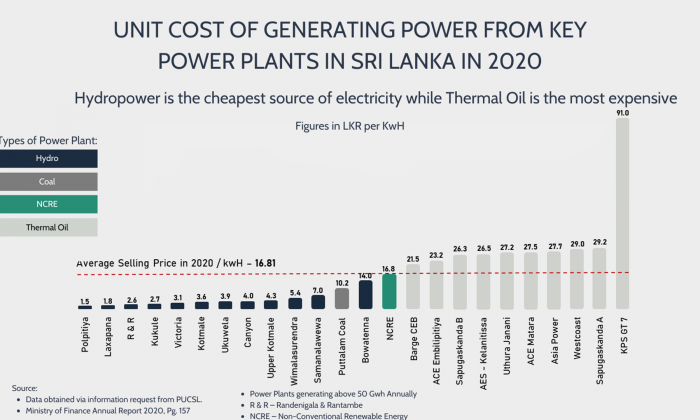
Cost of Generation from different power sources
The cost of generating power varies considerably based on the power source. The Infographic above shows the unit cost of generating power in 2020 from the key power plants that generate over 50 Gigawatt Hours (Gwh) annually. The figures show that the unit cost of generating power from the hydropower plants are the lowest compared to other sources of power generation in Sri Lanka. Amongst the powerplants considered in the Infographic, the unit cost of generating power from the hydropower plants averaged LKR 5.0 per Kwh during the year compared to LKR 10.2 per Kwh of coal power plant, LKR 16.8 Kwh of Non-conventional Renewable Energy power plants and a substantially high average of LKR 32.9 Kwh of the Thermal Oil power plants.
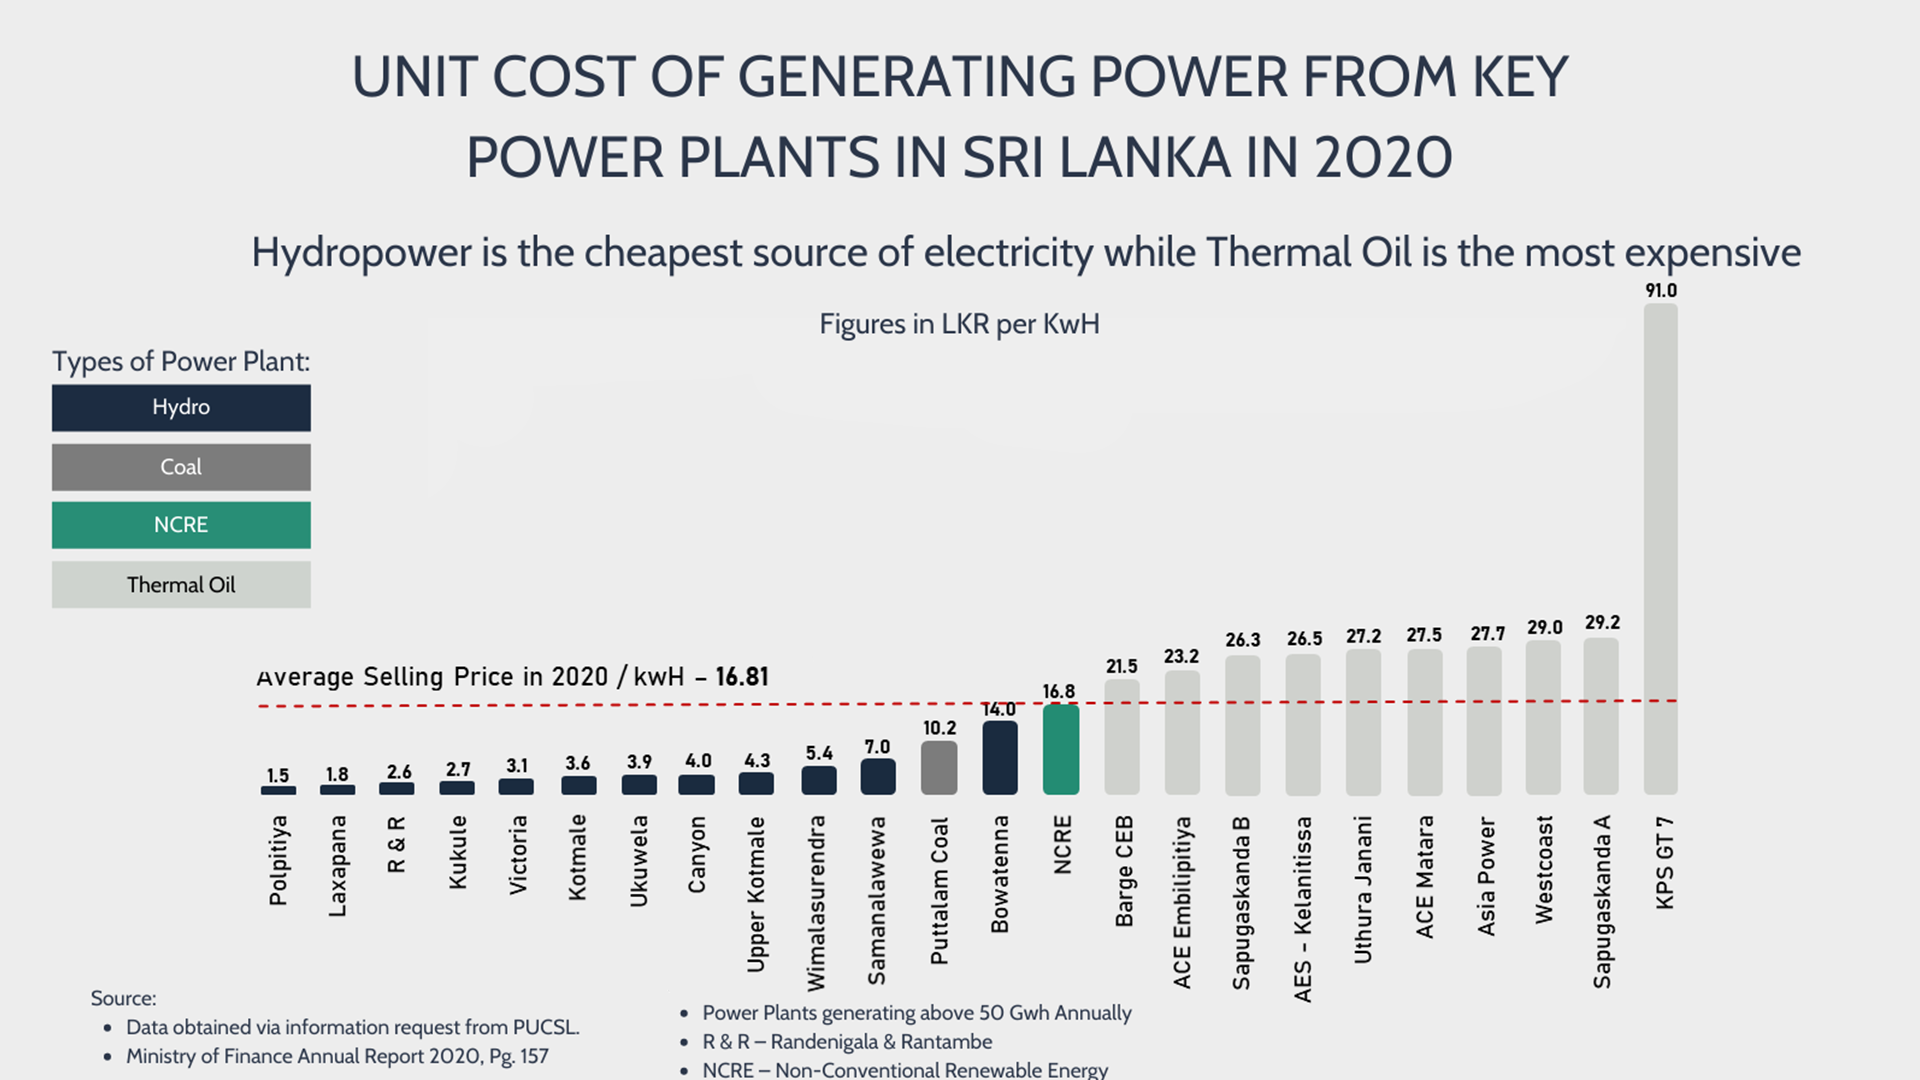
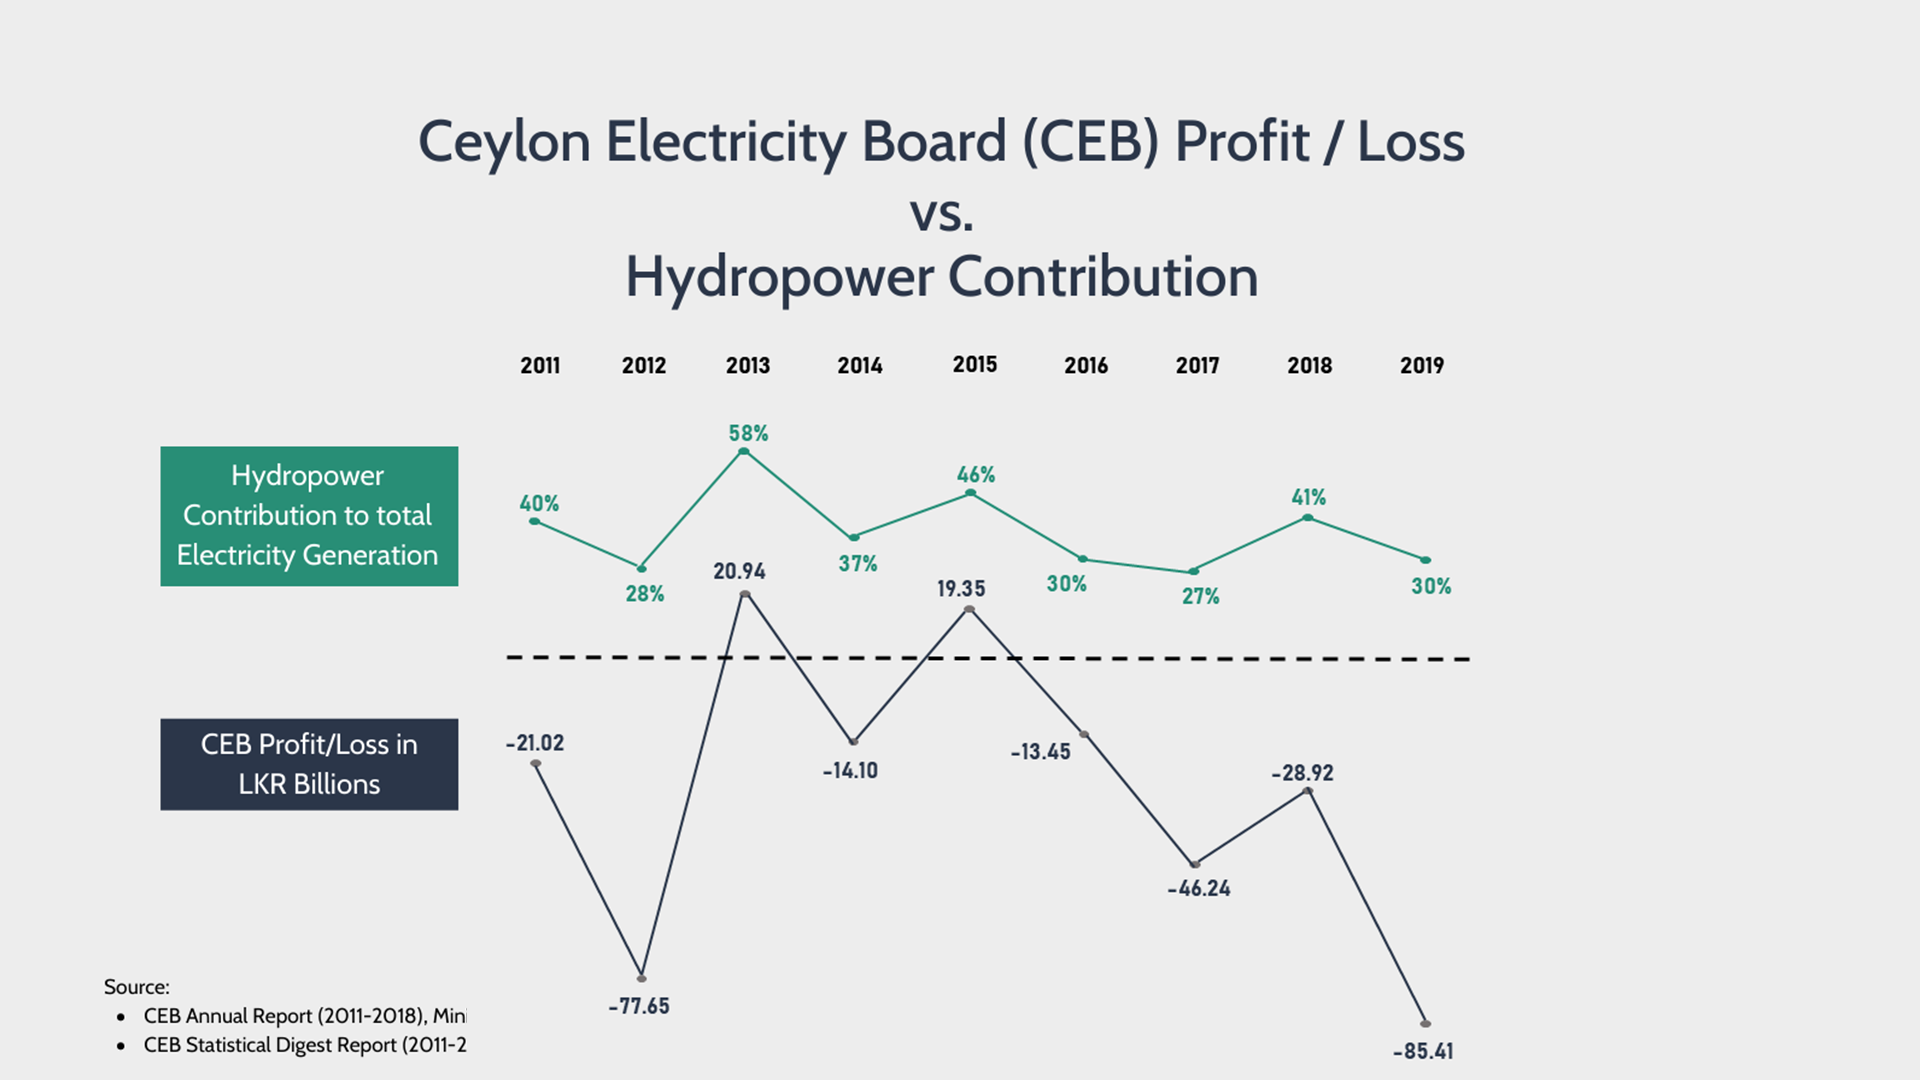
Profits increase with increases in hydropower generation
On average in the last 10 years, 66.9% of CEB’s total costs can be attributed to the power generation costs5. The composition of the source of power generation highly impacts the profitability of the CEB. As hydropower has the least generation cost, CEB’s profitability improves during years the hydropower contribution to the total electricity generation increases and vice versa as shown in the Infographic below. The infographic also demonstrates that the positive relationship between hydropower contribution and CEB’s profitability is consistent throughout the period from 2011 to 2019. In 2013 and 2015, share of hydropower generation peaked at, 58% and 46% respectively. It was only in 2013 and 2015, CEB managed to generate a profit as opposed to the loss it makes in the other years.
Hydropower contributed to almost 100% of electricity generation in the country till mid-19956. However, the contribution of coal and the more expensive oil-based generation to Sri Lanka’s electricity generation mix has seen a continuous rise over the years fueled by rapid growth in electricity demand over the last two decades and the limited potential to develop large new Hydropower facilities. This shift has significantly escalated the costs to CEB leading to massive losses.
Furthermore, contribution from hydropower plants are highly vulnerable to weather conditions which explains the frequent swings in its contribution in different years. During wet years, hydropower generation increases even beyond 40% of energy mix. But in dry years, oil-fired thermal power plants are heavily used to bridge the gap in Hydropower generation, and these are the years during which CEB’s profitability plummets heavily.
As a developing country, Sri Lanka’s demand for electricity will continue to increase in the future. Therefore, it is imperative for CEB to secure its energy future by focusing on the development and adoption of indigenous, renewable sources of energy that are more cost effective to meet this growing demand in order to emerge financially sustainable.
Source: