Free and Open Access to
Public Finance Data and Analysis
data-chart
Historical Government Debt, 1950 to 2021

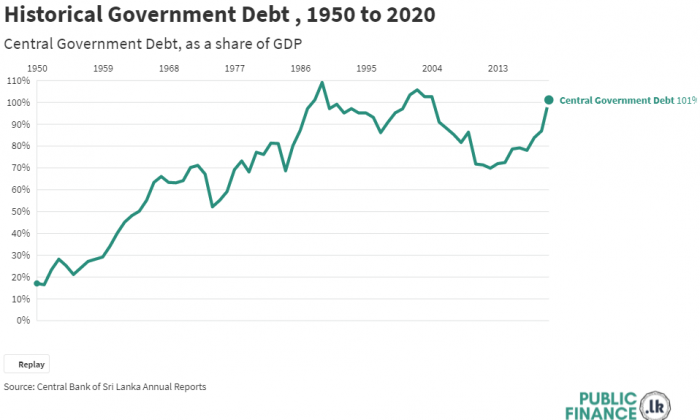
The diagram illustrates the Central Government Debt as a share of GDP from 1950 to 2020. Move across the year axis to select a year and identify the Debt to GDP ratio for that year. ​

 
2020-11-17
1 Comments
මට දැනගන්න අවශ්‍ය 1948/ සිට 2022 දක්වා වැඩිම ණය ප්‍රමාණයක් ලබාගත් ආණ්ඩුව කුමක්ද සහ ඔවූන් රුපියල් ශක්තිමත් කිරිමට ගත් ක්‍රියාමාර්ග
Nimantha Sampath
22 Mar 2023
Post a Comment